
The Regional Economic Development Strategies (REDS) Data Dashboards are interactive reports allowing users can interact with the data to conduct their own analysis and draw insights.
The reports are powered by Microsoft's PowerBI platform with the underlying data updated regularly.
Chart and data options
Interact with charts by selecting components within the chart. For example, selecting a column in a column chart will isolate data specific to that column.
By right-clicking on a chart, you can view the underlying data as a table.
You can also hover over chart components to surface an information box where you can focus the chart.
Navigation and controls
| Icon | Description |
|---|---|
| Expand the dashboard to full screen. Press [Esc] to return. | |
| Focus mode. This icon will expand the visualisation into a full screen. Press [Esc] to return. | |
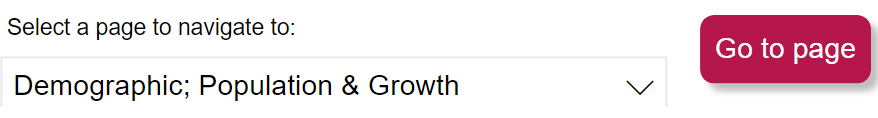
| Allows you to select a particular page. Choose the page from the dropdown menu and select ‘Go to page’ to open. |
| Additional navigation menu (full screen view only). |
| Additional page navigation options using arrows (full screen view only). |
Accessibility
The Microsoft Power BI application has limited accessible functionality. Microsoft are continuously working to improve this and we will implement any improvements as they are made available.
If you need access to a version of the dashboard suitable to your needs, please phone 03 9651 9999 or email rdv@rdv.vic.gov.au