Regional Victoria is a driving force behind our state's economic growth and prosperity.
Victoria's Regional Economic Development Strategies (REDS) identify strategic directions to further drive growth and prosperity in regional Victoria. The REDS represent a new direction in Victoria’s regional economic development, recognising that each region has unique strengths, challenges and opportunities.
The REDS provide a consistent evidence-based framework for understanding Victoria's regional economies. They can be used by all levels of government, regional communities, and businesses to work together, innovate, tackle challenges and make targeted investments to achieve stronger outcomes for their region.
The REDS will be central to making Victoria home to the nation’s most vibrant and successful regional economies.
Find your region's REDS below to learn more.
Each REDS is accompanied by:
- A one-page summary
- Supporting analysis providing detailed regional economic insights and data
REDS interactive data dashboards
To complement the REDS and REDS Supporting analysis, there are also nine interactive data dashboards, one for each Regional Partnership. The REDS data dashboards can be accessed via the links under the corresponding regions below. Much of the analysis described in the REDS Supporting Analysis is complementary to the dashboards and the two can be read in conjunction.
Before you begin, learn how to use the dashboards.
These dashboards will be periodically updated to keep the evidence base supporting the REDS up to date and relevant.
Regional Partnership regions
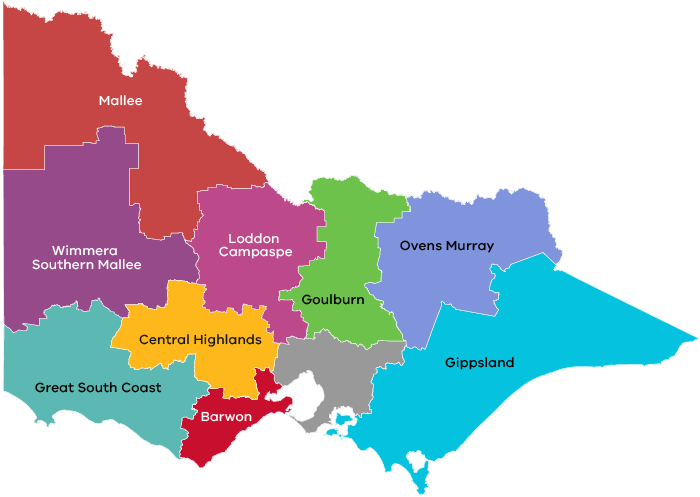
Click on your region below to access the REDS and interactive data dashboards.
Barwon
Explore the Barwon interactive data dashboard.

Downloads
- Barwon REDS - Summary (PDF 716.66 KB)

- Barwon REDS (PDF 3399.45 KB)
- Barwon REDS - Supporting Analysis (PDF 2690.87 KB)
- Barwon REDS - Accessible (DOCX 1413.08 KB)

- Barwon REDS Summary - Accessible (DOCX 52.67 KB)
Central Highlands
Explore the Central Highlands interactive data dashboard.
Downloads
- Central Highlands REDS - Summary (PDF 756.54 KB)
- Central Highlands REDS (PDF 7635.2 KB)
- Central Highlands REDS - Supporting Analysis (PDF 2708.83 KB)
- Central Highlands REDS - Accessible (DOCX 1292.78 KB)
- Central Highlands REDS Summary - Accessible (DOCX 47.69 KB)
Gippsland
Explore the Gippsland interactive data dashboard.
Downloads
- Gippsland REDS - Summary (PDF 518.69 KB)
- Gippsland REDS (PDF 3840.07 KB)
- Gippsland REDS - Supporting Analysis (PDF 2562.78 KB)
- Gippsland REDS - Accessible (DOCX 1201.46 KB)
- Gippsland REDS Summary - Accessible (DOCX 63.44 KB)
Goulburn
Explore the Goulburn interactive data dashboard.
Downloads
- Goulburn REDS - Summary (PDF 744.02 KB)
- Goulburn REDS (PDF 4846.64 KB)
- Goulburn REDS - Supporting Analysis (PDF 8029.78 KB)
- Goulburn REDS - Accessible (DOCX 5151.15 KB)
- Goulburn REDS Summary - Accessible (DOCX 66.55 KB)
Great South Coast
Explore the Great South Coast interactive data dashboard.
Downloads
- Great South Coast REDS - Summary (PDF 753.42 KB)
- Great South Coast REDS (PDF 5489.38 KB)
- Great South Coast REDS - Supporting Analysis (PDF 8318.58 KB)
- Great South Coast REDS - Accessible (DOCX 3067.8 KB)
- Great South Coast REDS Summary - Accessible (DOCX 72.13 KB)
Loddon Campaspe
Explore the Loddon Campaspe interactive data dashboard.

Downloads
- Loddon Campaspe REDS - Summary (PDF 515.22 KB)
- Loddon Campaspe REDS (PDF 5601.1 KB)
- Loddon Campaspe REDS - Supporting Analysis (PDF 2649.22 KB)
- Loddon Campaspe REDS - Accessible (DOCX 1440.71 KB)
- Loddon Campaspe REDS Summary - Accessible (DOCX 65.18 KB)
Mallee
Explore the Mallee interactive data dashboard.
Downloads
- Mallee REDS - Summary (PDF 755.71 KB)
- Mallee REDS (PDF 4151.04 KB)
- Mallee REDS - Supporting Analysis (PDF 7982.05 KB)
- Mallee REDS - Accessible (DOCX 4716.19 KB)
- Mallee REDS Summary - Accessible (DOCX 54.87 KB)
Ovens Murray
Explore the Ovens Murray interactive data dashboard.

Downloads
- Ovens Murray REDS - Summary (PDF 488.62 KB)
- Ovens Murray REDS (PDF 3379.07 KB)
- Ovens Murray REDS - Supporting Analysis (PDF 2417.38 KB)
- Ovens Murray REDS - Accessible (DOCX 2125.78 KB)
- Ovens Murray REDS Summary - Accessible (DOCX 64.9 KB)
Wimmera Southern Mallee
Explore the Wimmera Southern Mallee interactive data dashboard.